
Tesla is now reporting the paid robotaxi miles in the quarterly. It was about 200,000 miles in December. Tesla now has 500+ cars in Austin and SF Bay Area and is doubling each month (verbally reported as the number of robotaxi and the goal to increase on earnings call). A fleet of 2,000 cars in March 2026 (as per the doubling progression: 500 in Jan → 1,000 in Feb → 2,000 in Mar):
Base case (same ~4.77 rides/car/day): ~66,780 weekly rides (2,000 × 4.77 × 7, rounded).
Double intensity (~9.54 rides/car/day): ~133,560 weekly rides.
Triple intensity (~14.31 rides/car/day): ~200,340 weekly rides.
Tesla has the lower rides per car per day for now. Uber and waymo have about triple the daily usage. Doubling current levels would get the weekly rides. Tesla will be reporting cumulative miles. Have to get the miles and infer the rides at about 5 miles per ride standard average for rideshare and Waymo. Waymo 2500 cars give 450,000 weekly rides. Picture from page 11 of quarterly earnings.
In March to May, Tesla should definitively pass Waymo.
Tesla executives stated on today’s Q4 2025 earnings call (January 28, 2026) that Robotaxi operations in Austin have progressed to having no chase cars (follow vehicles), in addition to no safety monitors in the vehicle itself.
Ashok Elluswamy (VP of AI Software) “We were able to do our first rides with no safety monitor in the car in Austin. These were paid rides, so these were just sort of randomly selected paid rides with no safety monitor. I think maybe as of maybe yesterday or so, we actually don’t even have a chase car or anything like that. So these are just cars with no people in them, and no one’s following the car in Austin.”
Elon Musk -“Well, it is 100% unsupervised. FSD is 100% unsupervised. I mean, we obviously have cars operating with no one in them and no safety monitor and no follow car or anything like that in Austin right now.”
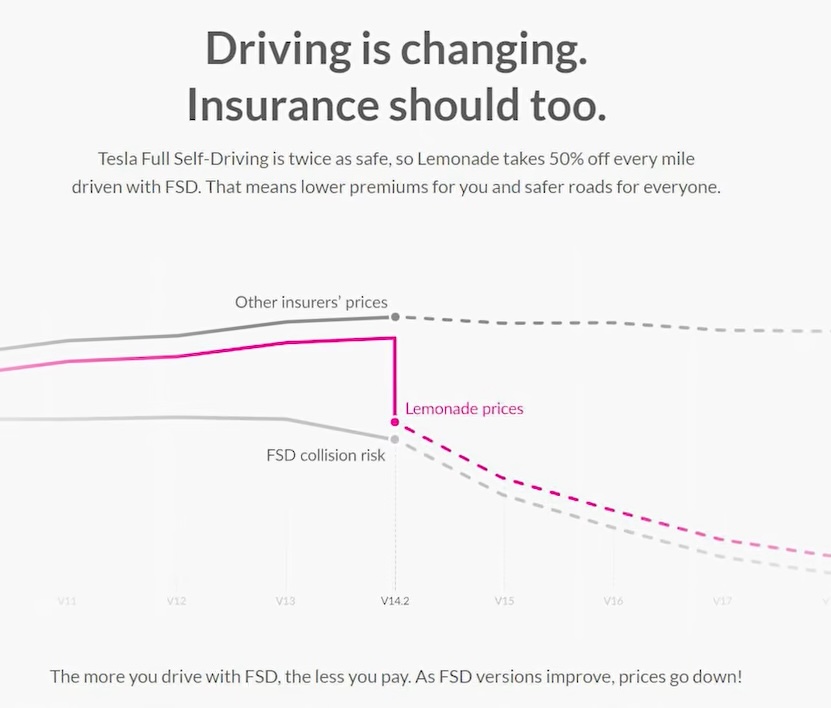
Insurance company Lemonade now reports and is will to insure Tesla cars with FSD at half the price per mile of Tesla cars without FSD in operation. Note the Lemonade graphic, they are projecting Tesla FSD to be ten times safer version 17. FSD 15 will have half of the risk of collisions. I believe this is an actuarial projection from data they are getting. Tesla already has 500+ cars as robotaxi. They said no chase cars and no safety monitors for some of the Austin cars.
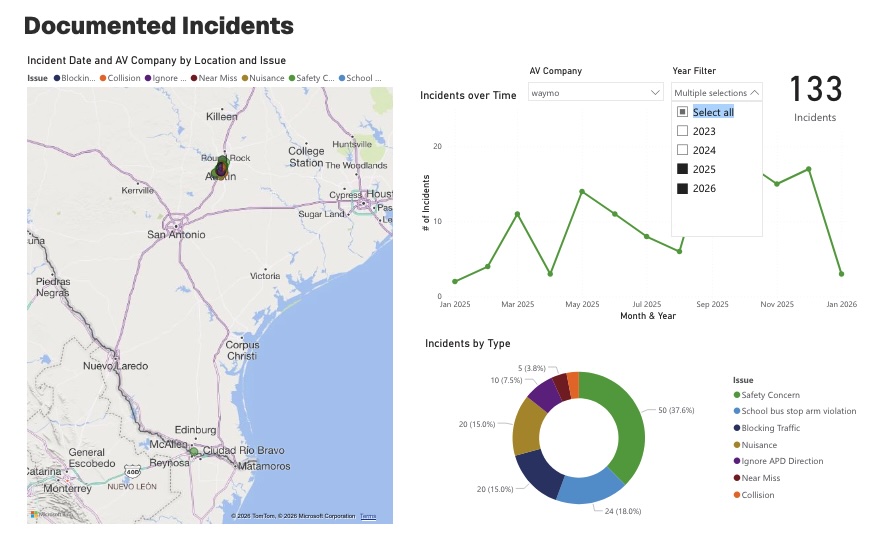
Waymo has 133 incidents reported in Austin. austin is 8% of the Waymo fleet. 40,000 rides per week, about 200k miles per week. Tesla reported 200k miles in December from about 250 cars. Tesla likely at 400k-600k miles in January. Intensity of usage can triple or more to get to Uber/Waymo levels. Safety monitors starting to come out. I think most out by end of February in Austin. 500 cars in Austin and 1500 cars in SF Bay area in March would align with new double every month and would be the prior end of December aspiration by Elon.
Waymo has 5 collisions and and 6 near misses in Austin out of 130 incidents.
NHTSA has over 100 accidents per month for Waymo. 25 per week on about 2 million miles per week. So we are saying Waymo is getting into one accident every 80,000 miles but 14:1 it is the other cars fault?
A website robotaxi tracker tried to use Google Gemini to analyze about 400 Waymo accidents. They get about 13-17% are Waymo at fault accidents. This would mean about 4 accidents per week are Waymo at fault. one in every 500,000 miles.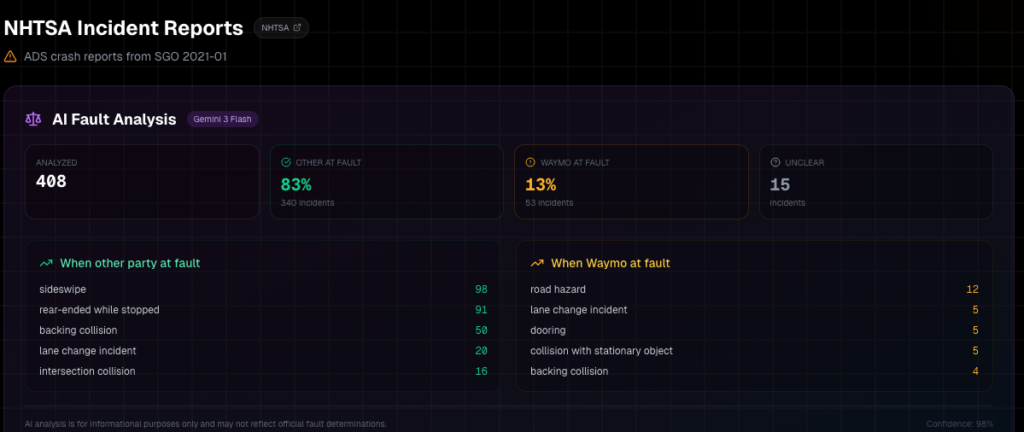
Also, Waymo blocks intersections of traffic like when their entire system and all vehicles went down in the SF power outage. 64 incidents of nuisance, blocking traffic and school bus violations in austin. out of about 4 million miles. 60,000 miles per blocking or related incident. Collisions in such a situation would not be just the other cars fault. 20 high risk conditions every 1.3 million miles. This is to get us to the Waymo claim of one at fualt collision every 1.3 million miles.
Human Drivers – USA
Near misses: These are much more common than reported crashes. Naturalistic driving studies (e.g., NHTSA’s 100-Car Study and related analyses) indicate that drivers experience near-crashes or critical incidents far more frequently—potentially several per year or even per month in high-risk scenarios. Some estimates suggest near-misses occur at rates 10–100 times higher than actual crashes, with drivers in observational studies showing hundreds of near-events over months of monitored driving. Anecdotal and survey-based reports often put noticeable near-misses at 1–2 per month for active drivers, though this varies widely. [aka you would “disengage human drivers every 1000 miles or so and critical disengagements every 5000 miles” if you could from the passenger seat”]
How many police reported versus unreported crashes?
Actual accidents for humans (police-reported crashes)- The average driver is involved in a police-reported crash roughly once every 10–18 years (150k-250k miles but. Insurance data often cites a collision claim about once every 17.9 years. With ~238 million licensed drivers and ~5.9–6 million police-reported crashes annually (including property damage only, injury, and fatal), this equates to a low per-driver annual probability, but cumulatively, most drivers experience 3–4 police reported crashes over a lifetime (6-10 police reported and unreported accidents. 4-10 years between accident one in every 70-150k miles).
At-fault accidents = Specific at-fault rates are harder to pinpoint nationally (as fault determination varies by state and crash reports), but studies show that in multi-vehicle crashes, roughly 50–60% involve at least one at-fault driver (often the one violating right-of-way or following too closely). Human drivers contribute to fault in the vast majority of crashes via errors like distraction or speeding. No precise national per-driver annual at-fault rate exists, but it’s a subset of the overall crash rate above.
More detailed breakdowns from NHTSA economic cost studies (e.g., Blincoe et al., referenced in recent analyses) indicate higher underreporting for specific severities: ~60% of property-damage-only (PDO) crashes are unreported, while ~32% of non-fatal injury crashes go unreported. Fatal crashes are essentially 100% reported. This means the overall ratio skews toward more unreported minor crashes, but police data covers nearly all serious ones.

Brian Wang is a Futurist Thought Leader and a popular Science blogger with 1 million readers per month. His blog Nextbigfuture.com is ranked #1 Science News Blog. It covers many disruptive technology and trends including Space, Robotics, Artificial Intelligence, Medicine, Anti-aging Biotechnology, and Nanotechnology.
Known for identifying cutting edge technologies, he is currently a Co-Founder of a startup and fundraiser for high potential early-stage companies. He is the Head of Research for Allocations for deep technology investments and an Angel Investor at Space Angels.
A frequent speaker at corporations, he has been a TEDx speaker, a Singularity University speaker and guest at numerous interviews for radio and podcasts. He is open to public speaking and advising engagements.