


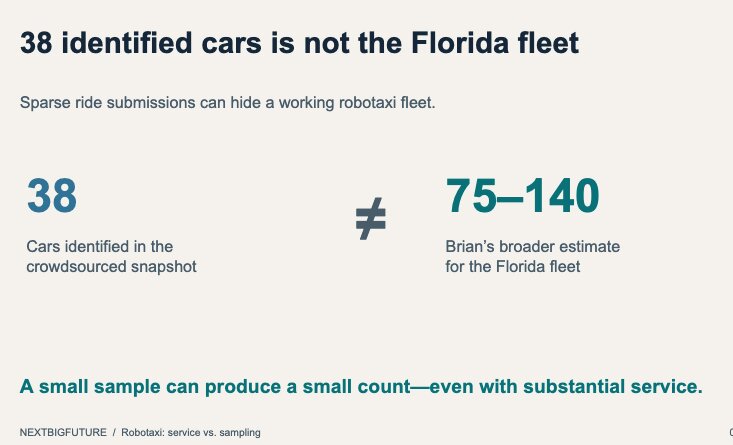
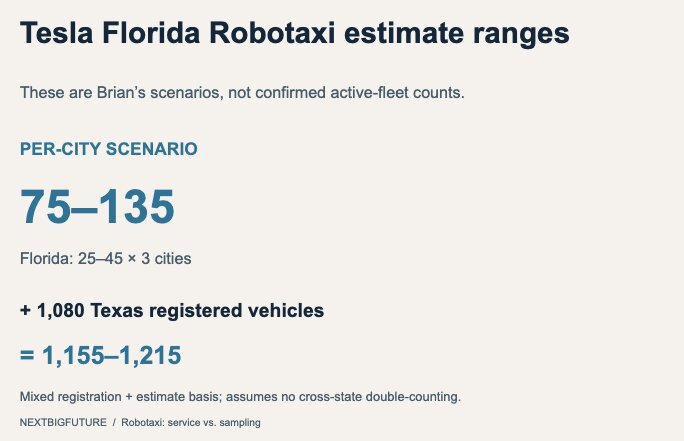
Florida and the artifact of low sampling of robotaxi rides. Instead of 38 Tesla robotaxi in Florida it is likely 75 to 140. Houston, Tampa, Miami and Orlando should have about the same number of Tesla robotaxi. They had similar geofence size (until Houston expanded) and were giving similar rides and miles each week. I estimate 1155 to 1220 Tesla robotaxi in Texas and Florida.
There are 1080 registered Tesla robotaxi in Texas.Actually, the three Florida cities each had more rides and miles than Houston the last few weeks.
If the robotaxitracker data was accepted then 5626 of paid robotaxi rides was given by zero active Tesla robotaxi.
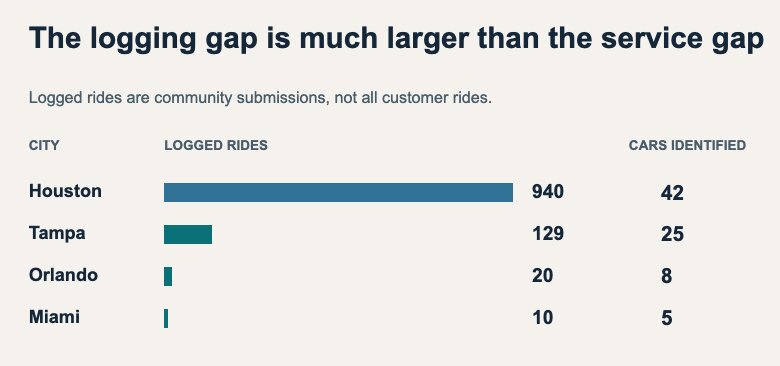
Tampa has 129 logged rides and 25 identified cars
Orlando has 20 logged rides and 8 cars and
Miami has 10 logged rides and 5 cars identified.
Houston had a a 30 square mile geofence before the jump to 250 miles. It has 940 logged rides and 42 identified vehicles, In July a surge to 25000 miles per week but the last 2 months about 4000-5000 miles per week. The last two to three months had less per week miles than each of the Florida cities. The more miles in each florida city indicates more active vehicles. 35-50 vehicles makes sense. They are more active than Houston. No reason to believe all vehicles in service are identified in Houston. The Geofence area of the four cities was about the same and weekly unsupervised miles was about the same. The difference was the logged rides.
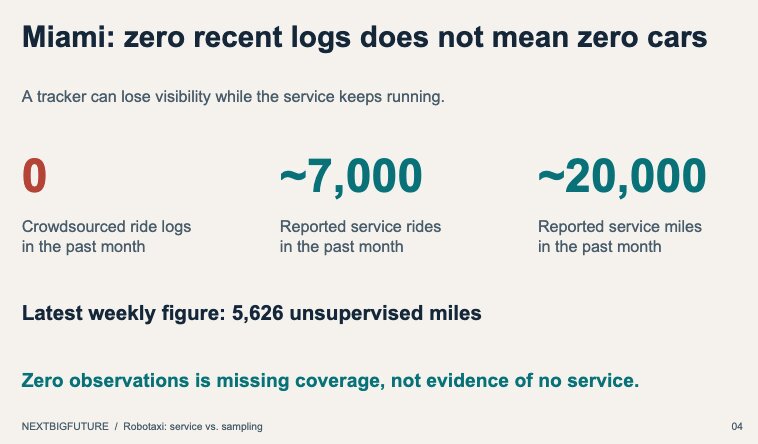
It is impossible for Miami to identify active in last 30 day cars via crowdshared logged rides. Because no rides were logged in the past month. But 20,000 miles and 7000 rides were given.
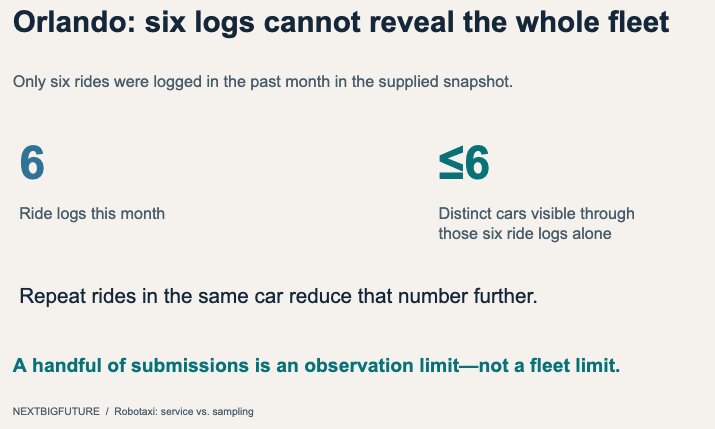
Orlando has logged 6 rides in the last month. Obviously, the crowdsourced robotaxitracker cannot identify many new cars in Orlando if only 6 rides were recorded in a month.
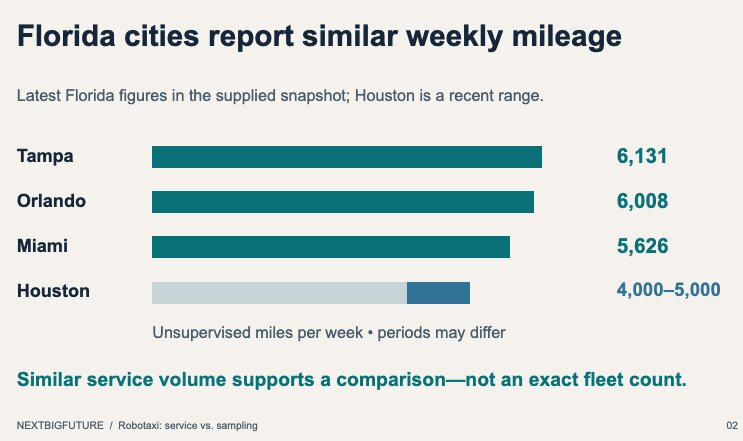
Tesla’s latest reported unsupervised (driverless) miles are in the same range for all three:
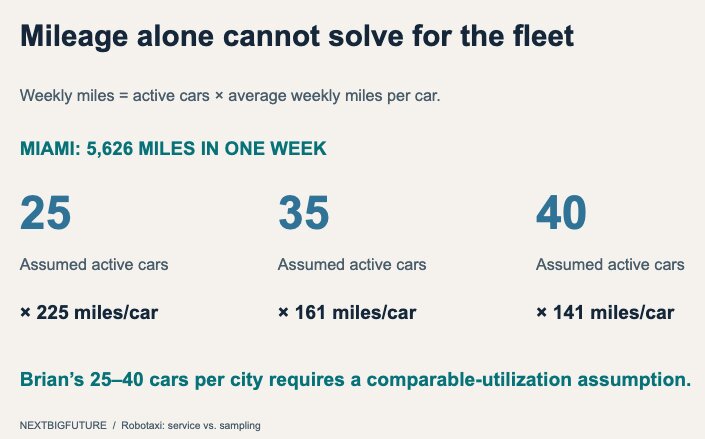
Miami: ~5,626 miles/week (46,262 cumulative through Oct 18)
Orlando: ~6,008 miles/week
Tampa: ~6,131 miles/week
The logical deduction is that there are 25-40 vehicles in all three florida cities.
That is roughly 6,000–8,000 miles/week each. At an average ride length of ~3–3.5 miles, this supports on the order of ~2,000 rides/week per city. The service areas are also similar in size (~24–31 square miles).
25 to 40 Tesla robotaxis per Florida city (Miami, Orlando, and Tampa), consistent with similar weekly miles. It is clear that zero active cars in Miami is wrong. No sampling at all in 30 days and 10 logged rides over perhaps the lifetime or 90 days
Tampa has logged 5 rides in the last 7 days. 6 rides in the prior week. 6 the week before that and 2 the week before that. No more than 5 cars could be spotted in Tampa. There has to be a poisson statistical sampling calculation against the 30 days with error bars and some 7 day approximation. We would need to look at a more active city like Austin and back into the 30 day versus 7 day activity.
Active Vehicle Approximation
6000 miles per week and 2000 rides per week in each of the three florida cities and Houston. 30-45 per city. Lower bound 90. in three florida cities.
Houston has 114 in the registered lookup. Houston expanded geofence and zone to 114.
150 estimate for active vehicles in Houston and three florida cities.
94000 miles in Dallas with 75 recorded cars.
84000 miles per week in Austin had 114 recorded cars.
Dallas has 75 to 108 cars. 567 logged rides in Dallas ever. 930 logged rides in Houston. Houston had more coverage than Dallas. 108 cars on registered lookup. 90-100 active estimate
Austin 450,000 miles in a week. 417 spotted, 719 in the registered lookup. 500-600 plausible. 450 lower bound of active in 7 days.
90 Florida
60 Houston
90 Dallas
450 Austin
690 for all cities.
Low mile cities 10,000 miles per week or less still have both lower miles week per vehicle. 200 miles per week approximate. 6000 miles per week is 30 cars active.
Mid range 100,000 to 500,000 miles per week. Go to 1000 miles per week per active vehicle.
Compared to Waymo – miles, rides and cars
Waymo National / high-level checks
Waymo’s published figures support the conversion method.
~3.90 million rider-only miles per week (Q2 2026 average) across all markets.
~4,000+ vehicles in the fleet (company statements + trackers; Texas alone has ~1,200 registered).Robotaxireport
That implies roughly ~900–1,000 miles per vehicle per week on average — matching the mid-range assumption of ~1,000 miles/week per active vehicle.
500,000+ paid rides per week also works out to a plausible ~100–150 rides per vehicle per week at that fleet size.

Brian Wang is a Futurist Thought Leader and a popular Science blogger with 1 million readers per month. His blog Nextbigfuture.com is ranked #1 Science News Blog. It covers many disruptive technology and trends including Space, Robotics, Artificial Intelligence, Medicine, Anti-aging Biotechnology, and Nanotechnology.
Known for identifying cutting edge technologies, he is currently a Co-Founder of a startup and fundraiser for high potential early-stage companies. He is the Head of Research for Allocations for deep technology investments and an Angel Investor at Space Angels.
A frequent speaker at corporations, he has been a TEDx speaker, a Singularity University speaker and guest at numerous interviews for radio and podcasts. He is open to public speaking and advising engagements.
