


I was deep into research for an article a few weeks ago, with somewhere around twenty tabs open across two windows, when switching between them started lagging by half a second. My usual response is to open Windows Task Manager and glare at the Chrome entry sitting at the top of the list. The problem is that Windows shows Chrome as a pile of nearly identical processes with names that tell you nothing. I could see that Chrome was using a lot of memory. I could not see which part of Chrome was responsible, so I closed a few tabs at random and hoped. That guessing game stopped once I realized Chrome ships with its own task manager, and it labels everything properly.
Chrome knows exactly what it’s doing with your RAM
It just never volunteers the information

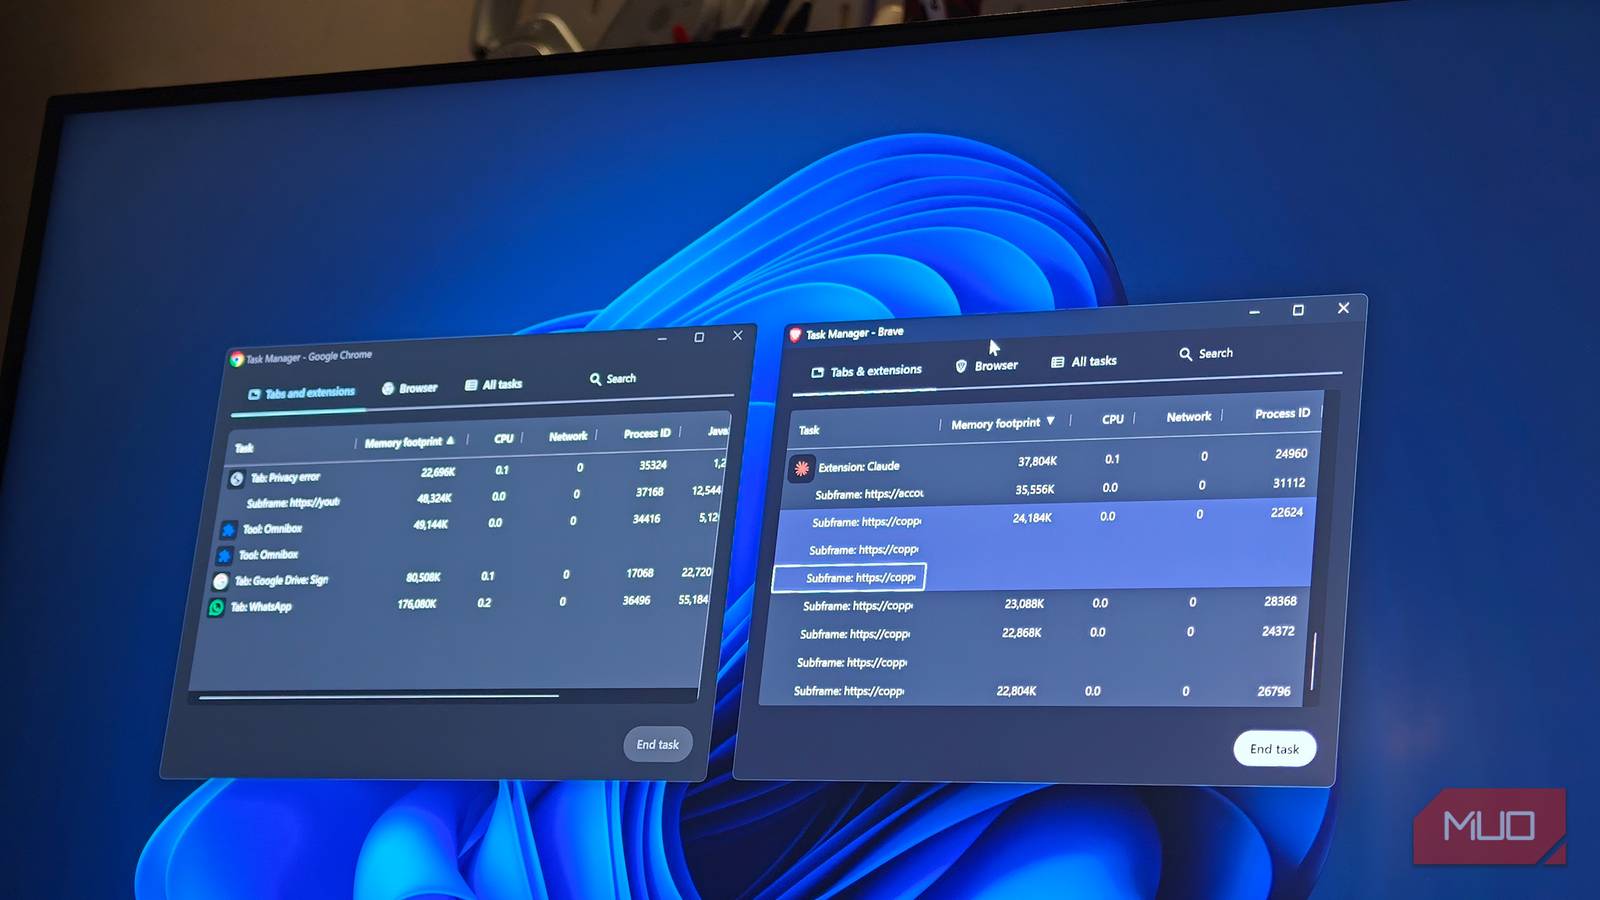
Press Shift + Esc while Chrome is focused and a small window appears listing every tab, extension, and internal process the browser is running. If that shortcut is taken by something else on your system, you can reach it from the three-dot menu under More Tools. On a Mac, it sits in the Window menu instead, since Shift + Esc is not bound there.
The difference from the Windows Task Manager is naming. Instead of a dozen entries all reading “Google Chrome,” you get the actual page title of each tab and the actual name of each extension, with a memory figure next to it. Sorting by the memory footprint column takes a second and shows you the top few offenders straight away.
Extensions are usually the surprise
They keep running whether you use them or not

Most people assume tabs are the problem, and tabs certainly add up. What caught me out was the Chrome extension section. A password manager, a grammar checker, and an ad blocker were sitting there using more between them than the ten pages I actually had opened.
This happens because extensions run for the whole session, not just when you click them. Some inject scripts into every page you visit, so their cost grows with the number of tabs even though they appear as a single line. If an extension you barely touch is near the top when sorted by memory, that is a reasonable candidate for removal.
A couple of hidden columns are worth adding

The default view gives you memory, CPU, network, and process ID. Right-click anywhere on the column header, and a longer list appears, and two of those extras earn their place.
JavaScript memory tells you how much a page is holding in its own heap, which is where a badly behaved web app usually shows itself. Idle wake-ups are useful on a laptop because a process constantly waking in the background will drain the battery even when its memory usage looks unremarkable. You only need to set these once, since Chrome remembers the columns you enable.
You can close one process without losing the rest
You don’t need to shut the whole browser down

Select a row in the list, click End process, and Chrome shuts down just that tab or extension while leaving everything else untouched. The tab stays in your tab strip and shows an error page, and clicking reload brings it back.
This is more useful than it sounds when one page has locked up. Rather than force-quitting the whole browser and losing your session, you can kill the single frozen tab and carry on. It also works as a quick test, because ending an extension’s process is faster than disabling it and restarting if you want to confirm it is the cause.
Where the Task Manager falls short
The numbers move, and they will not match Windows

The figures here are not stable. Memory shifts as pages render, garbage collection kicks in, and the same tab can read differently thirty seconds apart. It works well for spotting an outlier and poorly for precise measurements. The totals will also not line up with what Windows reports for Chrome because the two count shared memory differently.
There is one more limit worth knowing. The Task Manager shows you what is using memory, not why. A YouTube tab near the top of the list does what a video player is supposed to do, and a large Google Sheet file will sit high for the same honest reason.
A news article you opened two hours ago and never closed has no such excuse, and if its number keeps climbing while you are not even looking at it, that is a leak rather than legitimate work. Chrome will not draw that distinction for you, so watching a suspicious tab for a few minutes is the only real way to tell them apart.
Check it before you blame your RAM
I still open too many tabs, but I have stopped closing them blindly. Two or three times now, the answer has been a single extension I had installed for one task and forgotten about, and removing it helped more than shutting down half my browsing would have. It takes a keyboard shortcut and about ten seconds of sorting, which is a reasonable trade for knowing what is actually going on inside the browser you leave open all day.
