

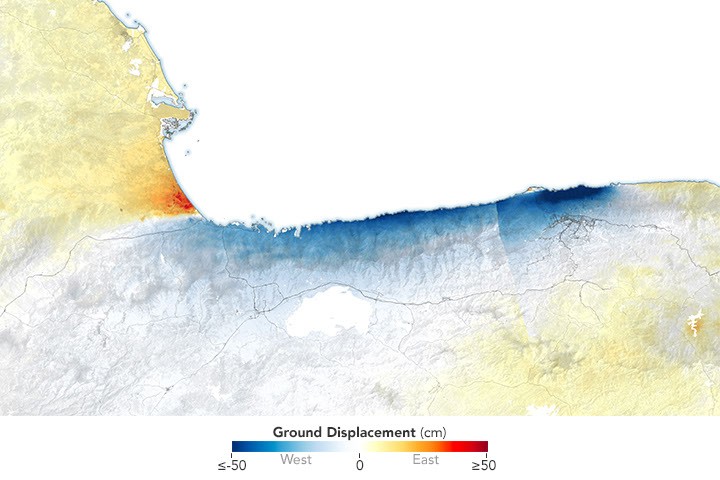

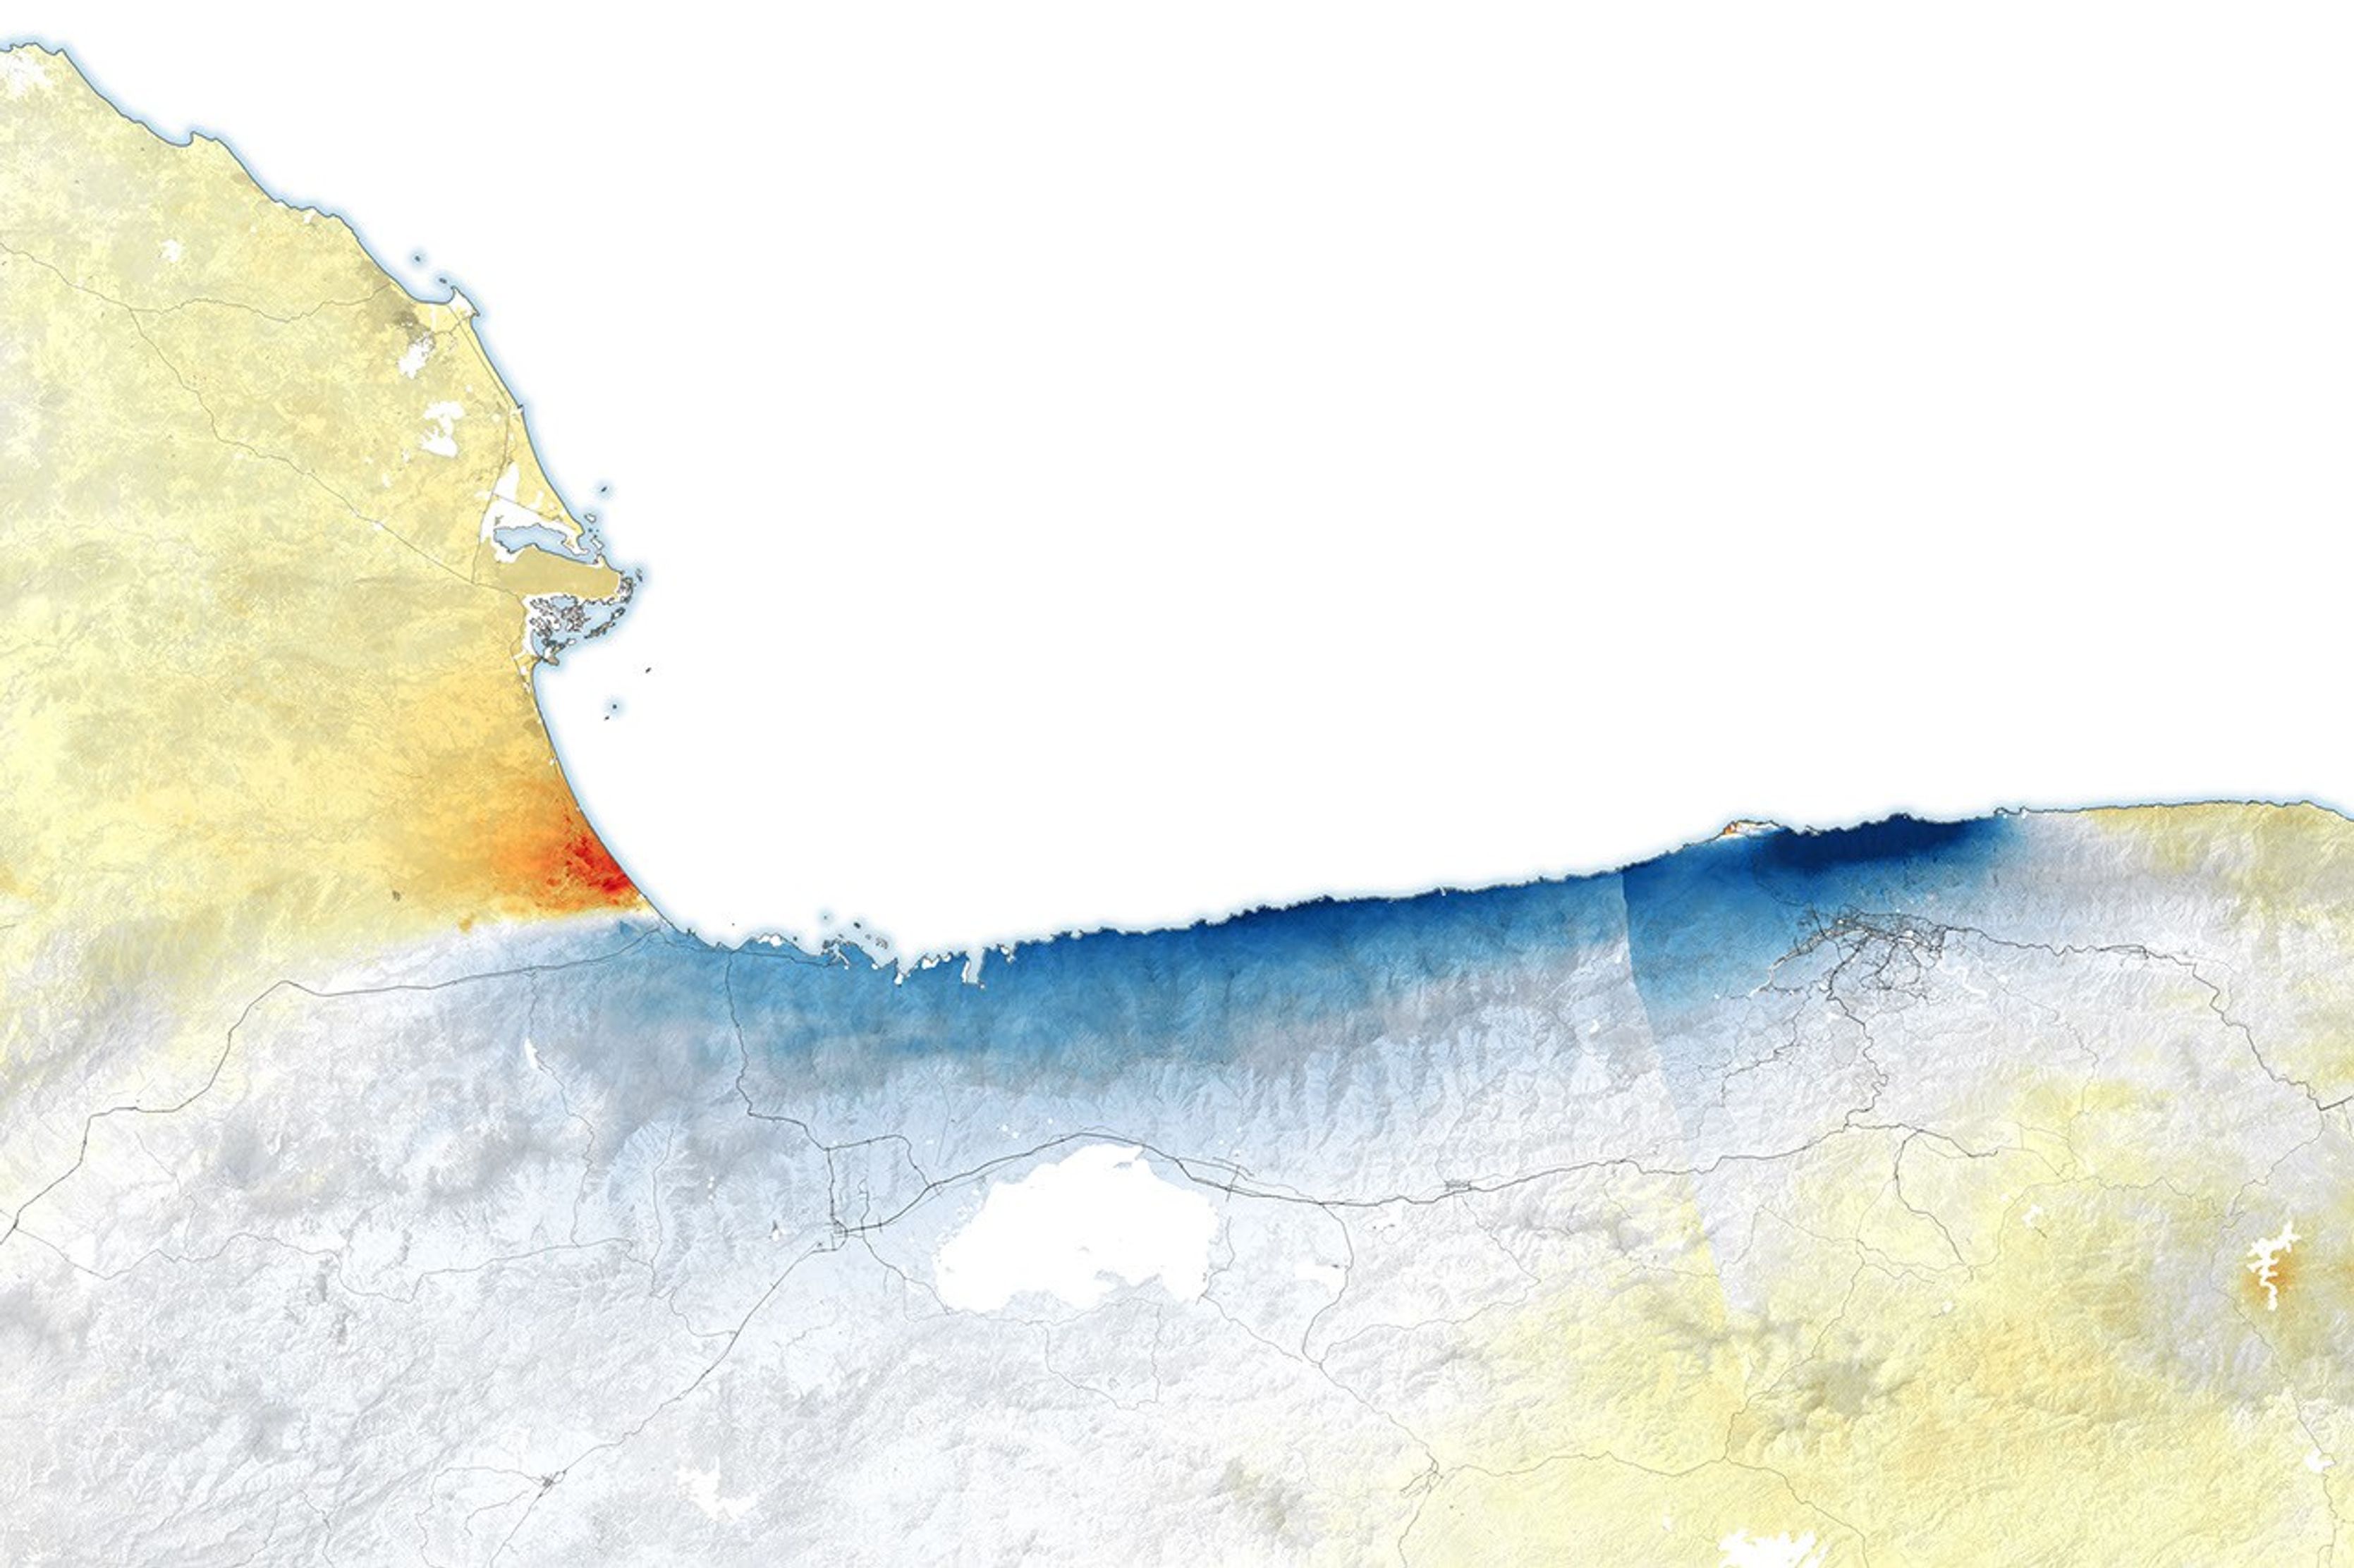
On June 24, 2026, a magnitude 7.2 earthquake struck northern Venezuela, followed under a minute later by a magnitude 7.5 mainshock. Together, the quakes left immense damage and loss of life across the region. In the days that followed, satellite-based maps of ground displacement revealed how the land surface moved, providing insight into the forces behind the severe destruction in locations such as La Guaira and other coastal cities in La Guaira state.
This map was produced using data from the NISAR (NASA-ISRO Synthetic Aperture Radar) satellite and processed by the NISAR science team at NASA’s Jet Propulsion Laboratory (JPL). Scientists used a technique called InSAR, which compares data from repeat passes to detect subtle changes in the distance between the satellite and the ground. Images acquired on June 25 and June 30, after the quakes, were compared with images from June 13 and June 18, before the quakes.
NISAR views Earth at an angle, about 40 degrees from straight down, allowing it to capture a mix of horizontal and vertical displacement. In this map, red areas show where the ground moved east and up; blue areas moved west and down. Because the earthquake occurred on a strike-slip fault, however, most of the displacement shown in this map was horizontal (east and west).
White areas indicate little to no land displacement, including a thin strip near the middle-left of the scene, close to Morón, marking roughly where the fault ruptured at depth. The fault is part of a network of fractures that lies along the boundary between the Caribbean plate to the north and the South American plate to the south. Scientists say faults along this plate boundary, including the San Sebastián fault system where these quakes likely occurred (and possibly part of the Boconó system), have long been accumulating strain.
The fault rupture propagated offshore, toward the east, and then back onshore near the international airport north of Caracas, marked by the narrow white band visible between westward and eastward displacement. Just south of this fault section, the deep blue color indicates that the westward surface displacement along this part of the fault was far greater than elsewhere, reaching as much as 60 centimeters (24 inches).
“These are reasons why the damage in Caracas and La Guaira was so extreme,” said Eric Fielding, a geophysicist at JPL who provided the maps. “InSAR tells us a lot about what happened during this earthquake.”
Using the NISAR data, the U.S. Geological Survey refined its fault-slip model, or “finite fault model,” to better constrain how the fault slipped at depth, including along the rupture’s eastern section. “That is extremely helpful for the people who need to understand why damage was so severe in that area,” Fielding said.
The displacement maps for this event were provided through NISAR’s Urgent Response (UR) system, a fast-track process that can deliver data within 12 to 24 hours to support disaster response. The rapid processing relies on predicted orbit information, so UR maps are preliminary until they are later reprocessed with precise orbit information, typically within a day or two. This marks the first time the NISAR UR system has been used to map surface displacement from a large earthquake.
NASA Earth Observatory map by Lauren Dauphin, using data provided Eric Fielding and processed by the NISAR science team at NASA’s Jet Propulsion Laboratory (JPL). Story by Kathryn Hansen.
- NASA (2025, July 23) Interferometry. Accessed July 9, 2026.
- NASA Earth Observatory, (2025, September 15) Mapping Kamchatka Earthquake Displacement. Accessed July 9, 2026.
- NASA Earth Observatory, (2025, April 15) Satellite Data Show Motion of Burma Earthquakes. Accessed July 9, 2026.
- NASA’s Disasters Mapping Portal (2026, July 9) Venezuela Earthquake June 2026. Accessed July 9, 2026.
- U.S. Geological Survey (2026, June 24) M 7.2 – 21 km ENE of San Felipe, Venezuela. Accessed July 9, 2026.
- U.S. Geological Survey (2026, June 24) M 7.5 – 20 km ESE of Yumare, Venezuela. Accessed July 9, 2026.
