

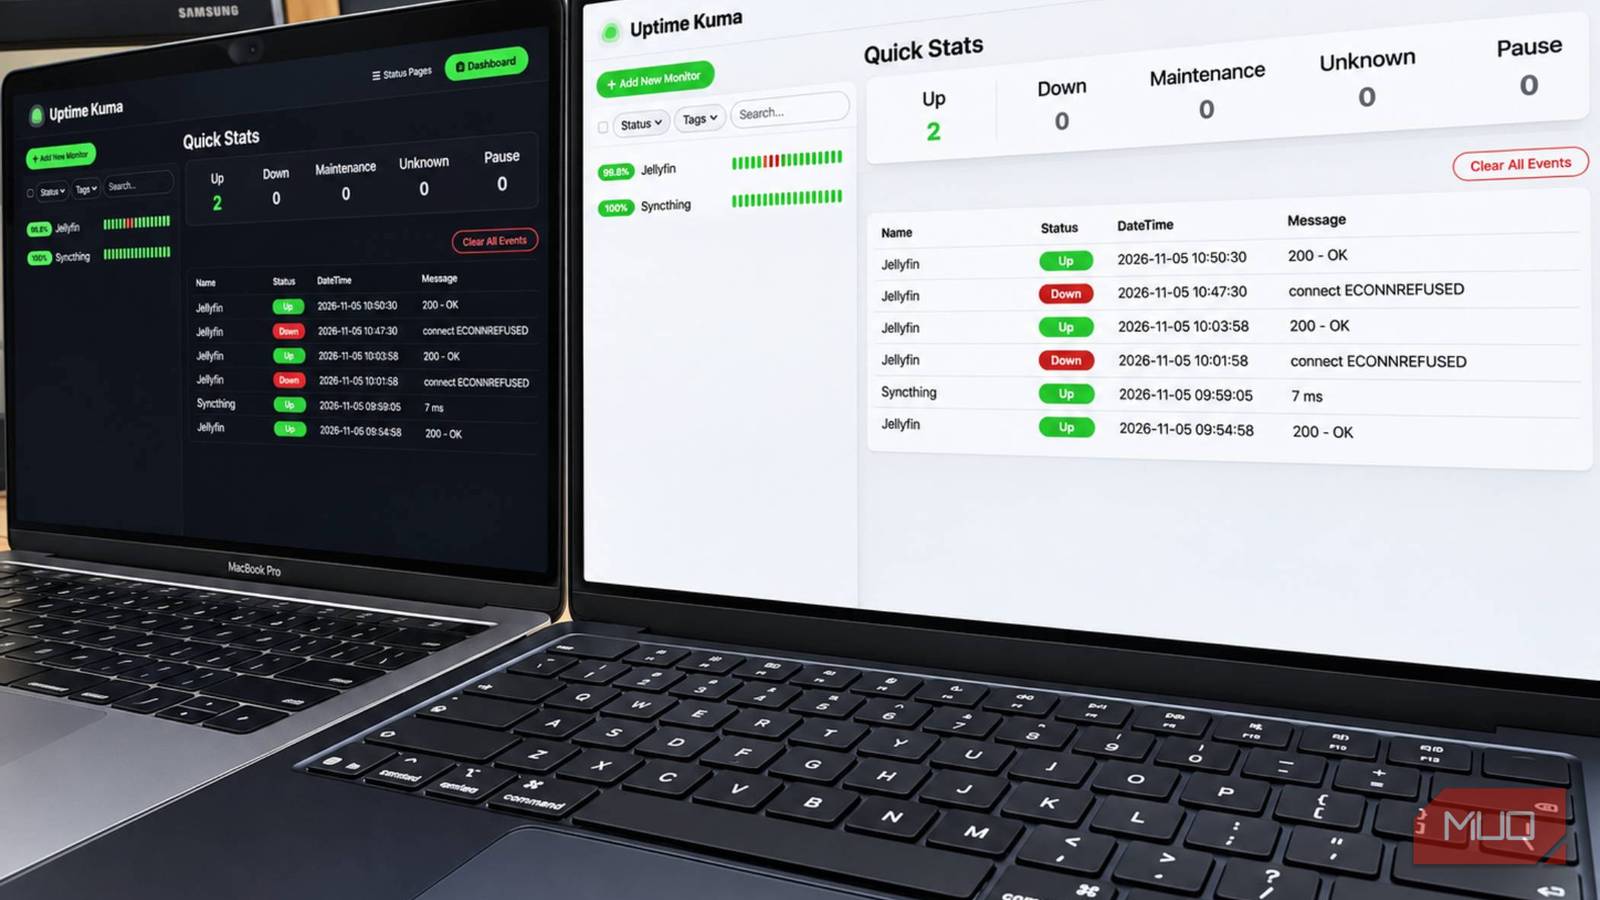

I recently turned my old MacBook into a home server, and everything is running great; however, what happens when something suddenly stops working? I needed a simple way to keep tabs on it without having to manually check that everything is running as it should. The solution I found is Uptime Kuma, a free, open-source monitoring tool that provides a central dashboard for tracking the availability of your self-hosted services.
Uptime Kuma offered the perfect solution
Now I can monitor my home server from a single hub

Uptime Kuma displays activity data for all your configured self-hosted services on a smart dashboard. It supports several monitoring methods, including HTTP(s), TCP ports, DNS, and ping, allowing you to track everything from your business website to a service running inside your home network.
To test Uptime Kuma, I already had Jellyfin and Syncthing running in Docker on my MacBook Pro home server, so this was a good place to start. I then added monitors for each in Uptime Kuma and connected it to Telegram, so I’d receive notifications when something went wrong.
Uptime Kuma itself runs in Docker, so installation was relatively straightforward. I created a dedicated folder for its data, added a small Docker Compose configuration, and launched the container. I could then access the dashboard through port 3001 on the MacBook. From there, I selected SQLite as the database and created an administrator account.
That was it! Now I could start adding services to monitor.
Adding services was straightforward
Adding Jellyfin and Syncthing took only a few minutes
Adding a monitor is straightforward, as long as you understand how your services are configured.
You are asked to choose the monitoring type, give it a name, and provide the address or port you want Uptime Kuma to check. For Jellyfin, I selected HTTP(s) and entered http://host.docker.internal:8096, since Uptime Kuma runs in its own Docker container. I set the heartbeat interval to 60 seconds and opted for one retry. This means Uptime Kuma checks the service once every minute and gives it another chance to respond before declaring it’s down.
For Syncthing, I used a TCP Port monitor, entering host.docker.internal as the hostname and 22000 as the port. This differs from Jellyfin, as here I’m checking whether Syncthing’s TCP port is responding, not whether it is actively syncing my files.
Now I had a simple dashboard setup that showed whether my two services were up or down. I tested it by stopping Jellyfin in Docker and waiting for Uptime Kuma to respond. Sure enough, once it had time to cycle through its checks (here, the status showed as Pending), the status changed to Down, and precise outage times were marked in red on the response-time graph.
Meanwhile, Syncthing remained online, which was exactly what I wanted to see.
I wanted to be notified of outages
Adding a Telegram bot means I don’t have to watch the dashboard
A dashboard is useful when I’m sitting at my workstation, but one of my main reasons for running a home server is to use it remotely. I therefore wanted to know about any issues when I’m away from home.
Uptime Kuma supports several notification services, including Telegram. I created a bot using Telegram’s BotFather, noted its bot token and chat ID, and entered those details in Uptime Kuma’s notification settings. Once the connection was tested successfully, I enabled Telegram alerts for my Jellyfin and Syncthing monitors.
Next, I repeated my outage test, this time watching Telegram. When Jellyfin went down, I received a notification. When I restarted it, another message confirmed that the service had recovered. Result!
This made the configuration almost complete, since I could now receive an alert without keeping the Uptime Kuma dashboard open (although the container itself must remain running). There was just one final piece of the puzzle remaining.
I wanted to access my dashboard remotely
Tailscale gives me remote access for a complete monitoring solution

Uptime Kuma isn’t much use if I can only view it when I’m sitting right next to my home server, so I wanted remote access. I already use Tailscale to connect to my home server, so I didn’t need to install another Docker container. I kept Tailscale running directly on macOS and used the MacBook’s Tailscale IP address to reach Uptime Kuma from another device.
Rather than using localhost to point to my remote device, I can access the dashboard at: http://MY-TAILSCALE-IP:3001. To access Jellyfin, I use the same process and change the port to 8096. As long as both devices are connected to my Tailscale network, I can securely access these services from anywhere.
So my Uptime Kuma monitoring setup was finally complete, and it does exactly what I needed it to, albeit with one important caveat. It can detect when my services stop responding, but it can’t reliably alert me if the entire MacBook loses power, goes offline, or becomes unreachable.
The home server, Docker Desktop, and Uptime Kuma container all need to remain running to keep Uptime Kuma operational. If the host itself goes down, Uptime Kuma goes down with it. I also need to keep the Mac awake and ensure Docker Desktop and Tailscale start automatically, so there are a few things to consider for everything to work smoothly.
I’d recommend Uptime Kuma as an addition to any home server
Uptime Kuma isn’t a solution to all my home server issues, but it does make spotting those problems much easier. I can see whether my services are responding, check their uptime history, and receive Telegram notifications when something changes.
Perhaps best of all, the entire service is free and relatively easy to install and configure for remote access. If you’re also running a few self-hosted services and could use another way to keep an eye on things, Uptime Kuma is well worth installing.

- OS
-
Linux, Windows, Docker
- Developer
-
Louis Lam
- Price model
-
Free, Open-source
